
The Butterfly Effect in Index Funds and the Mathematical Ripple Behind Mega Cap Growth
22 September, 2024
Over the past two decades, the investment landscape has witnessed a significant shift in the balance of power between large and small companies. As small-cap stocks were once touted as the growth engines of the stock market, the rise of mega-cap companies, especially within the technology sector, has redefined market dynamics. A surprising explanation for this phenomenon has emerged, one that draws from the world of nonlinear dynamics: the butterfly effect.
In this article we will look into the hypothesis that index fund flows—small, almost imperceptible at first—have compounded over time, contributing significantly to the rise of large-cap stocks and their dominance in financial markets. Building on academic research and financial theory, we explore how passive investing influences market dynamics and how the butterfly effect—a small cause leading to large outcomes—can explain the unexpected growth of mega caps.
Small Index Fund Flows cause Large Market Impacts
At the heart of this analysis is the hypothesis that the consistent, incremental inflows into index funds have a compounding effect on the relative market capitalization of large companies. Traditionally, index funds purchase stocks in proportion to their market capitalization. Therefore, it might seem that passive investing should not favor one stock over another in an index. Yet, research by Hao Jiang, Dimitri Vayanos, and Lu Zheng suggests otherwise.
Their findings highlight that index fund flows disproportionately increase the market cap of larger companies over smaller ones due to the nonlinear response of stock prices to demand. This phenomenon is driven by price inelasticity in large-cap stocks—a concept we will explore further in this article.
The Butterfly Effect in Financial Markets
The butterfly effect, a principle derived from chaos theory, refers to the idea that tiny changes in one part of a system can lead to significant outcomes in other parts of the system. Edward Lorenz, a meteorologist, first introduced this concept when he demonstrated how small changes in weather patterns could lead to vastly different outcomes over time.
In the context of financial markets, the Lorenz Curve can be adapted to illustrate how market capitalization is increasingly concentrated in a small number of mega-cap stocks over time, leaving smaller stocks with a diminishing share of the total market. As passive index fund flows have steadily increased over the past two decades, the Lorenz Curve for market caps has shifted—mirroring the rising inequality of wealth distribution in society.
When index funds purchase stocks, they do so in proportion to a company’s market capitalization. Over time, these small and consistent inflows into large-cap stocks create a reinforcing feedback loop: the larger a company’s market cap becomes, the more index funds buy its stock, leading to further increases in price and market dominance. This is akin to the butterfly effect, where a small and seemingly insignificant action (small index fund flows) cascades into much larger outcomes (the outsized market caps of mega-companies like Apple, Amazon, and Microsoft).
As the Lorenz Curve shifts over time, it demonstrates how market power becomes increasingly concentrated among fewer large-cap companies, just as income inequality curves shift when wealth is increasingly concentrated among the richest individuals. The butterfly effect explains why these shifts in market dominance happen so dramatically: a small, sustained flow of capital into large-cap stocks gradually amplifies over time, leading to a disproportionately large impact on their market valuations.
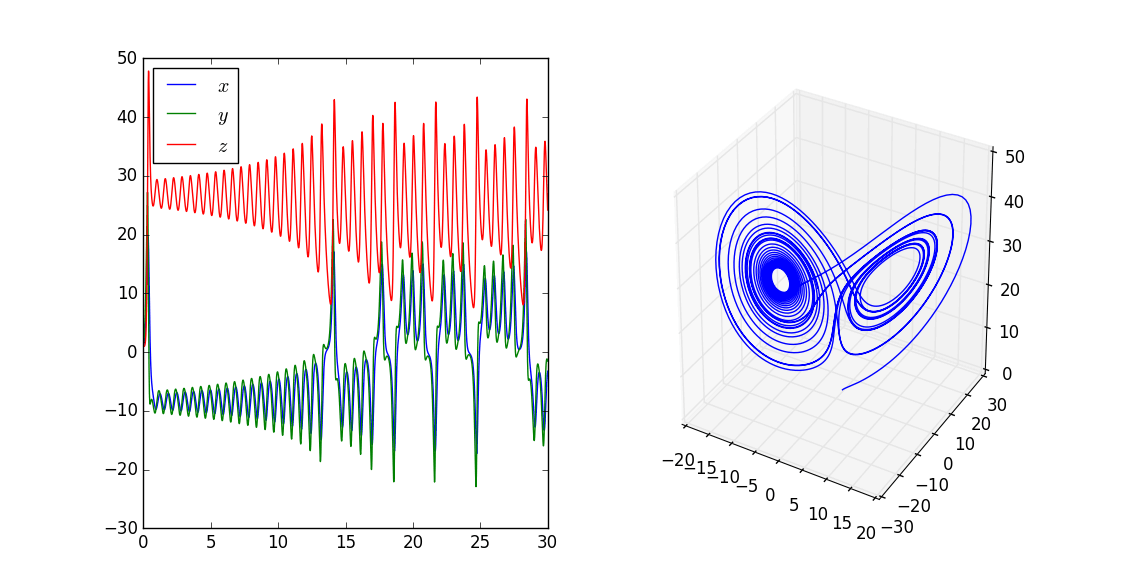
Lorenz Attractor and Market Instability
Further extending this analogy, the Lorenz Attractor—a visual representation of the chaotic behavior in systems—can also be applied to financial markets. The attractor illustrates how complex systems, like weather or financial markets, can follow unpredictable and highly sensitive paths due to small changes in initial conditions. In our setting, this reflects how seemingly stable market trends, such as the rise of passive investing, can suddenly shift due to small disruptions or shifts in investor sentiment. If passive fund flows were to slow down or reverse, it could disrupt the delicate balance that has allowed mega-cap stocks to dominate. This potential shift could lead to a rapid reallocation of capital into small-cap stocks, reversing the trend depicted by the Lorenz Curve and introducing new forms of market instability.
Ultimately, the Lorenz Curve and the butterfly effect help explain why financial markets, like many complex systems, are susceptible to significant shifts over time. Small, seemingly trivial actions—such as the steady inflows into index funds—can result in large-scale, long-term outcomes that reshape the landscape of the market, concentrating wealth and power in the hands of a few dominant players.
The Inelasticity of Demand for Large-Cap Stocks
Research by Valentin Haddad, Paul Hübner, and Erik Loualiche helps explain why large-cap stocks react more strongly to index fund flows. They identified that the demand for larger companies is more inelastic compared to smaller companies. This inelasticity stems from the fact that large-cap stocks, such as Apple or Microsoft, are considered essential holdings by both active and passive investors.
As demand for these large-cap stocks rises, their prices increase disproportionately, even with a small uptick in demand. In contrast, smaller stocks—those whose ownership can be more easily adjusted based on valuation—do not experience the same price sensitivity.
Mathematical Model: Price Elasticity and Market Impact
The price elasticity of demand is defined as:
Elasticity = % change in quantity demanded / % change in price
For large-cap stocks, like Apple or Microsoft, the price elasticity of demand is low (inelastic). This means that even if the price of these stocks increases, the quantity demanded does not decrease significantly. In contrast, small-cap stocks tend to have higher price elasticity (elastic), meaning that changes in price result in more noticeable changes in the quantity demanded.
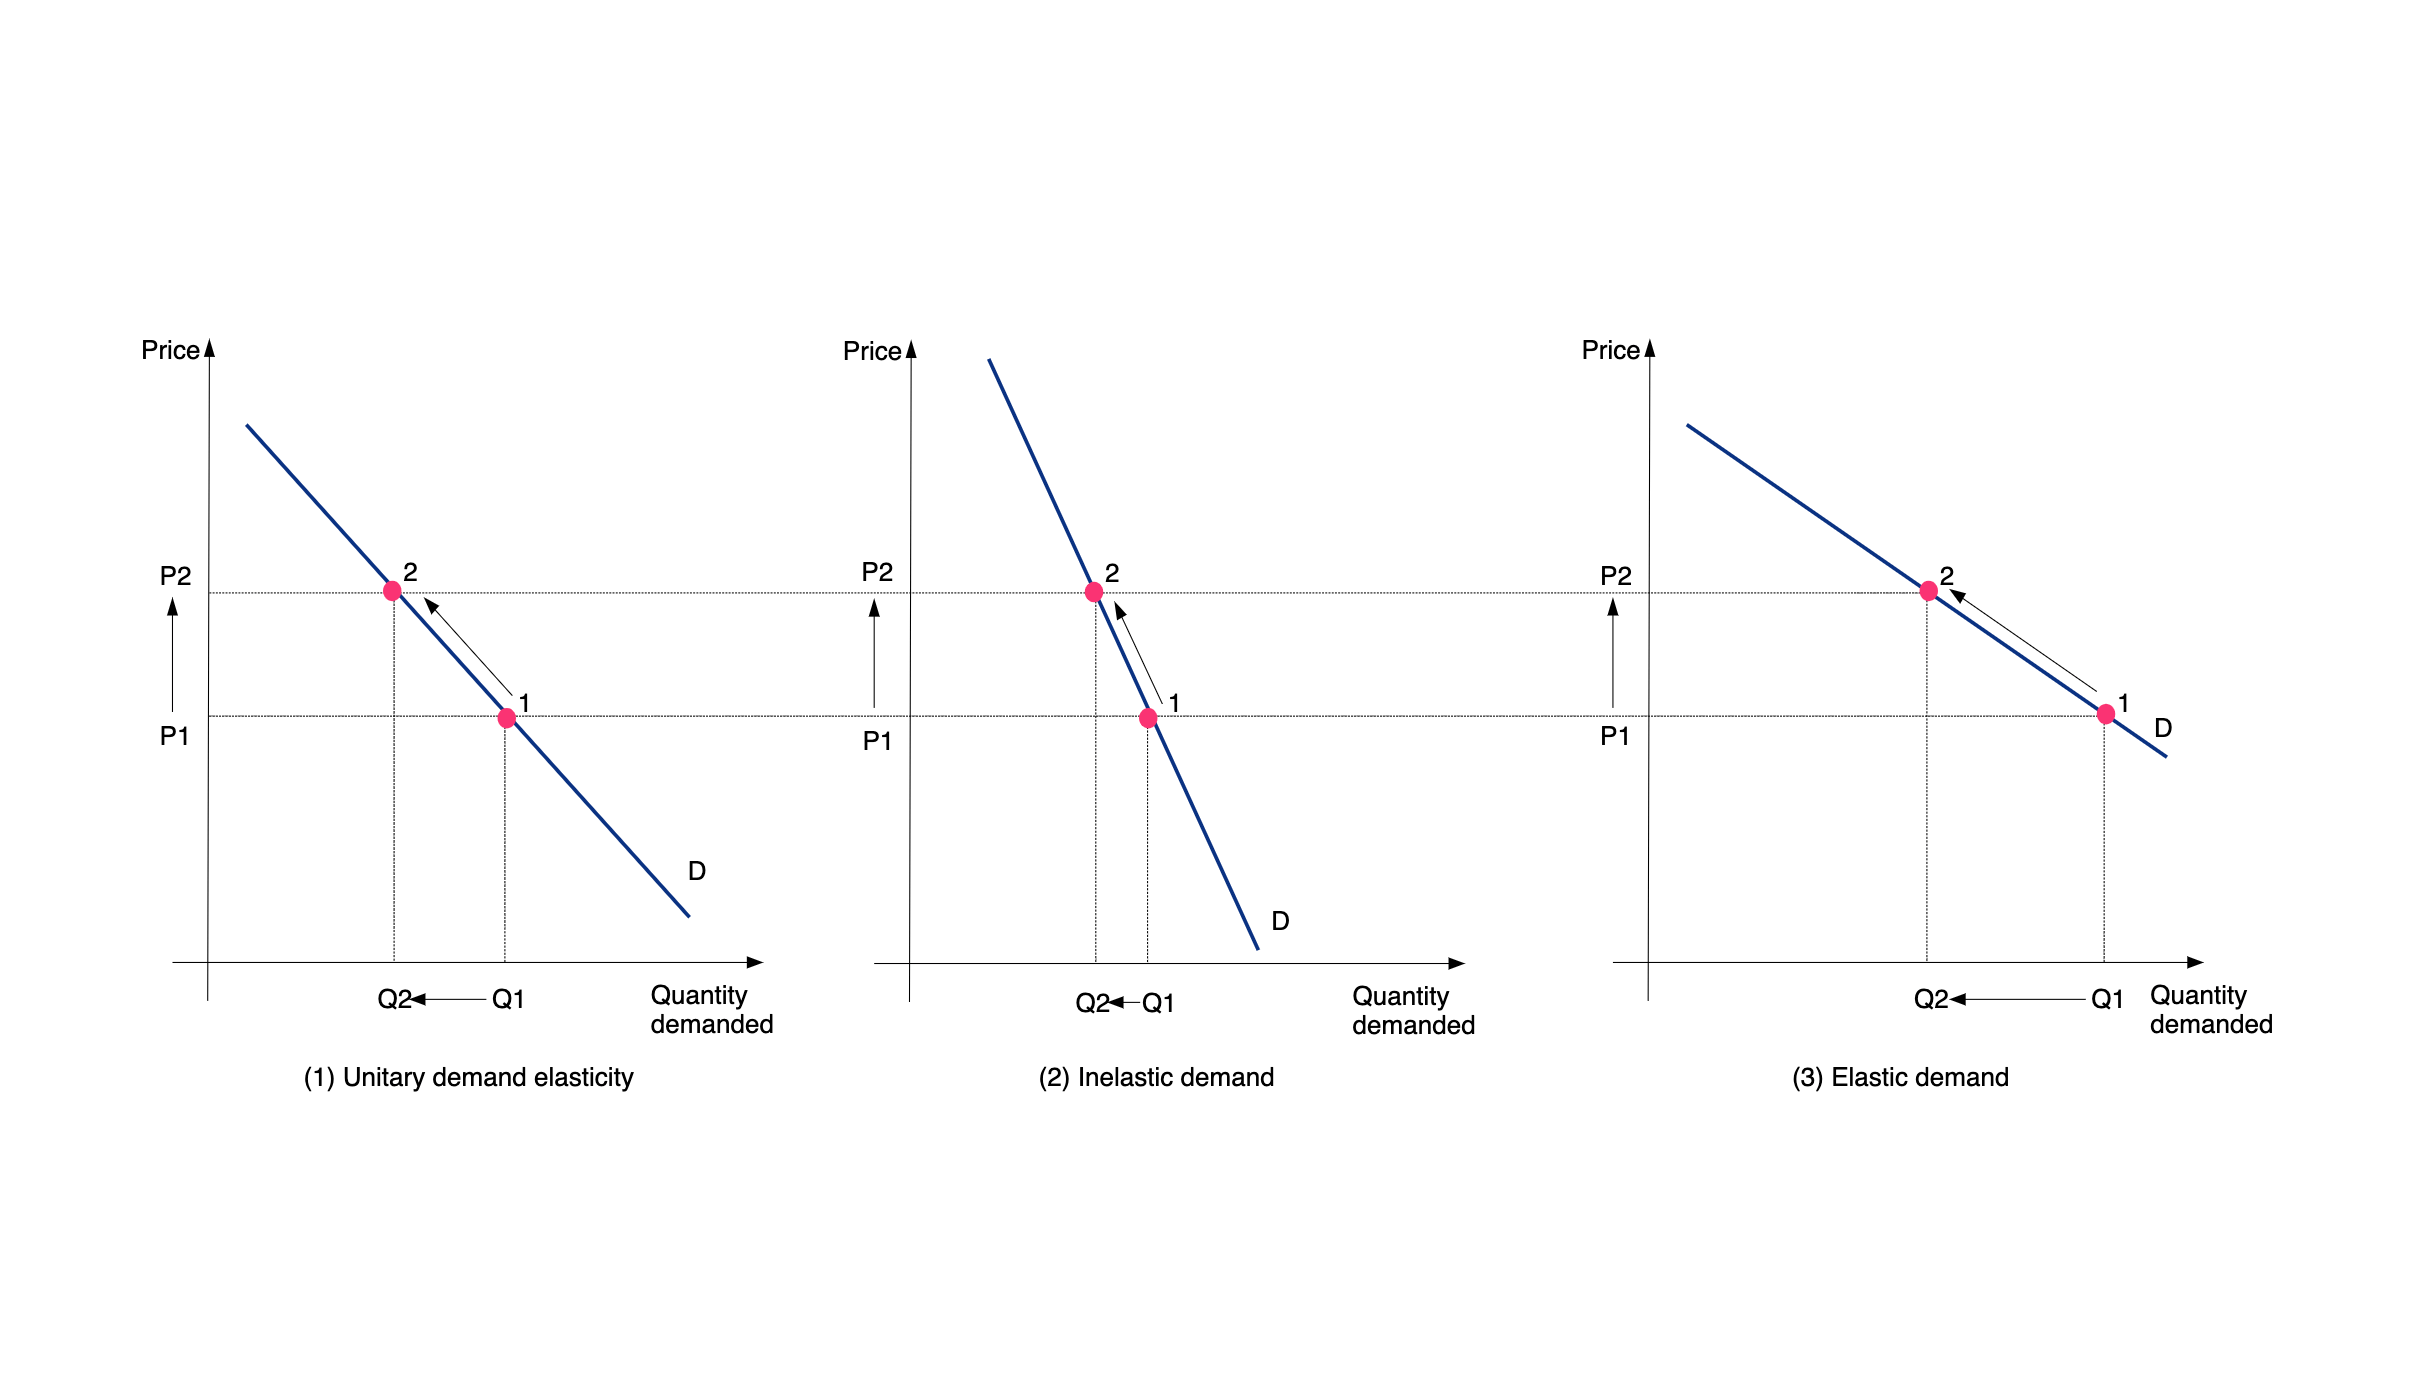
How Elasticity Drives Market Cap Growth
In practical terms, inelastic demand for large-cap stocks means that even small inflows—like those from index funds—can cause disproportionately large increases in stock prices. Index funds purchase stocks in proportion to their market capitalization, but because of the inelastic nature of demand for large companies, the price of these stocks increases more than that of smaller-cap stocks when demand rises. This leads to a nonlinear relationship where large-cap stocks experience outsized price appreciation relative to small caps, despite similar inflows.
E_d (mega-cap) < 1, E_d (small-cap) > 1
To clarify this effect further:
- For a mega-cap stock, a small increase in demand (from index funds) leads to a relatively larger increase in price because of the inelasticity.
- For a small-cap stock, the same increase in demand leads to a smaller price increase, as these stocks are more elastic, meaning their prices are more sensitive to changes in demand.
This explains why mega-cap companies, like those in the S&P 500, have seen their market caps grow substantially more than smaller companies in recent years. The table below summarizes the relationship:
| Stock Size | Price Elasticity | Market Cap Change (due to index flows) |
|---|---|---|
| Mega-Cap | Low (Inelastic) | High (+10%) |
| Small-Cap | High (Elastic) | Low (+2%) |
Compounding Effects Over Time
The nonlinear response to inflows is further compounded over time. Research indicates that, over a 25-year period, the market capitalization of large companies grows 30.25% larger than it would have without index fund inflows. This phenomenon is a perfect example of the butterfly effect in financial markets, with seemingly small inflows triggering a chain reaction that leads to disproportionately large outcomes in terms of market capitalization.
Thus, price elasticity, when coupled with consistent passive fund inflows, creates a feedback loop: large-cap stocks become more dominant over time, while smaller stocks struggle to keep up, reinforcing the concentration of market power in the hands of a few mega-cap companies.
The Future of Small-Cap Stocks: A Reversal in Trend?
With mega-cap stocks seemingly entrenched in their position of dominance, the question arises: Will small-cap stocks ever regain their historical edge? One possible scenario is the stagnation of index investing. If passive flows slow down or reverse, small-cap stocks could see renewed investor interest, potentially leading to a shift in relative market caps.
Additionally, some researchers, such as Cliff Asness, argue that the rise of passive investing has reduced market efficiency, creating opportunities for active managers to exploit mispriced stocks. This inefficiency, combined with potential shifts in capital flows, might pave the way for small-cap stocks to regain prominence.
Conclusion
The intricate relationship between passive fund flows and market dominance reflects a deeper truth about financial markets: they operate in a complex, nonlinear system where small, consistent actions can yield outsized, sometimes unintended consequences. The butterfly effect and Lorenz Curve serve as powerful metaphors for how these dynamics unfold, illustrating the compounding effects of passive investing on the rise of mega-cap stocks.
However, the real lesson is not just about the mechanics of market dominance—it’s about the unpredictability and fragility embedded in these systems. Just as small changes can accelerate the growth of large-cap stocks, they can also trigger dramatic shifts in market behavior when conditions reverse. This sensitivity to initial conditions, captured by chaos theory, reminds us that markets are far from stable or linear.
For investors and policymakers, the key takeaway is that while passive investing has been a major force in shaping today’s markets, it also introduces potential risks. The concentration of market power in a handful of stocks creates vulnerabilities that could unravel quickly with small shifts in capital flows. Understanding these nonlinear dynamics is essential not only for navigating the current market landscape but for anticipating how future changes—whether regulatory, technological, or economic—might reshape it yet again.
In a world increasingly influenced by passive strategies, the challenge is to remain agile in a system that is both powerful and unpredictable, where small causes can lead to profound effects.